Buyer fragmentation matters: $1bn marketplaces have at least 1 million buyers

Published September 17, 2018

This is the third in a series of essays on my learnings and findings from a six month marketplace research project. There has been a lot written about online marketplaces and our goal was to test these theories by exploring patterns from a broader set of companies. We started by making a list of every marketplace founded, creating a list of 4,500 companies from Crunchbase, Pitchbook, and other sources. We then collected public data to classify and compare these companies, and identified the characteristics of  successful marketplaces (read more about the approach).

Marketplaces typically aggregate suppliers at scale to provide competitive prices and broad selection to buyers. Amazon, Airbnb, and Uber connect millions of sellers, hosts, and drivers to tens of millions of buyers, travelers, and riders.

Conventional wisdom is that marketplaces benefit from high fragmentation in demand and supply to drive perfect competition in both sides of the marketplace. Our data indicates that aggregating a large number of buyers is far more important than a large number of suppliers.

Both web and mobile adoption have enabled new services to aggregate millions of buyers (e.g. eBay on the web, Uber on mobile). Our data shows that since 1990, entrepreneurs have shifted their focus as new platforms emerge (Web 1.0, Web 2.0, mobile). We found that one of the most popular marketplace categories in the 1990s also had the highest failure rate: wholesale trade (i.e. business to business marketplaces). There weren’t enough buyers online in 1999 to build a large B2B marketplace business, but this is no longer true in 2018.

A large, fragmented market of buyers is required to build a significant marketplace business

Each dot on the scatter plot1 below represents a single marketplace and shows the relationship between that marketplace’s revenue and the number of buyers (right chart) or number of suppliers (left chart). There is a much stronger relationship between the number of buyers and revenue than between the number of suppliers and revenue.2

These scatter plots show a higher correlation between buyers and revenue than between suppliers and revenue.

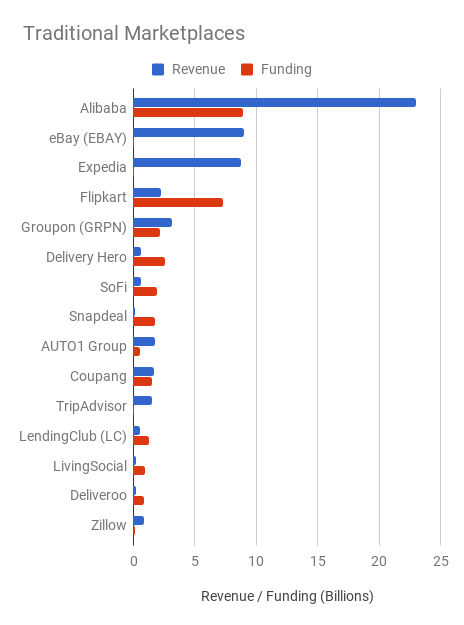
There is only one marketplaces in our dataset that has more than $100 million in revenue and less than 1 million buyers (Upwork).3Of the top 20 marketplaces, half of them them have fewer than 100,000 suppliers. LendingTree has only 300 suppliers but almost $500m in revenue. Some other notable examples include Coupang (25,000 sellers, $1bn+ in GMV in 2016), JustEat (~82,000 restaurants and $700m revenue in 2017), and Grubhub (80,000 restaurants and $680m revenue in 2017).

Some marketplaces, like Uber, require very high density of supply at a particular location and time. These require millions of suppliers to deliver on the promised user experience (keeping wait times below 5 minutes in the case of Uber). But marketplaces that need millions of suppliers to deliver buyer value are the minority. Of the marketplaces in our dataset with more than $100m of revenue, only ⅓ of these have more than one million suppliers.4

Platform shifts have enabled new marketplace opportunities.

New platforms have created opportunities for marketplace businesses by aggregating a critical mass of buyers. eBay leveraged the internet to attract a million buyers by 1999, 4 years after it was founded. Uber took advantage of mobile devices to aggregate a million riders by 2013 (also 4 years after it was founded).

The below graph shows what types of marketplaces were started by time period.  While retail marketplaces were the most popular marketplace categories in each time period, the #2 and #3 categories in each period change as entrepreneurs take advantage of new buyer markets that become accessible by these new platforms.

Before 2003, the most popular marketplace categories for entrepreneurs were use cases that took advantage of the web’s global reach: retail and accommodations (hotels). The largest marketplaces today are retail and accommodations marketplaces started in this period (Amazon, Alibaba, Booking.com, eBay) that expanded the addressable market for retailers and hotel companies.

This bar graph shows what categories of marketplaces were the most popular for entrepreneurs to start, organized by time range. 

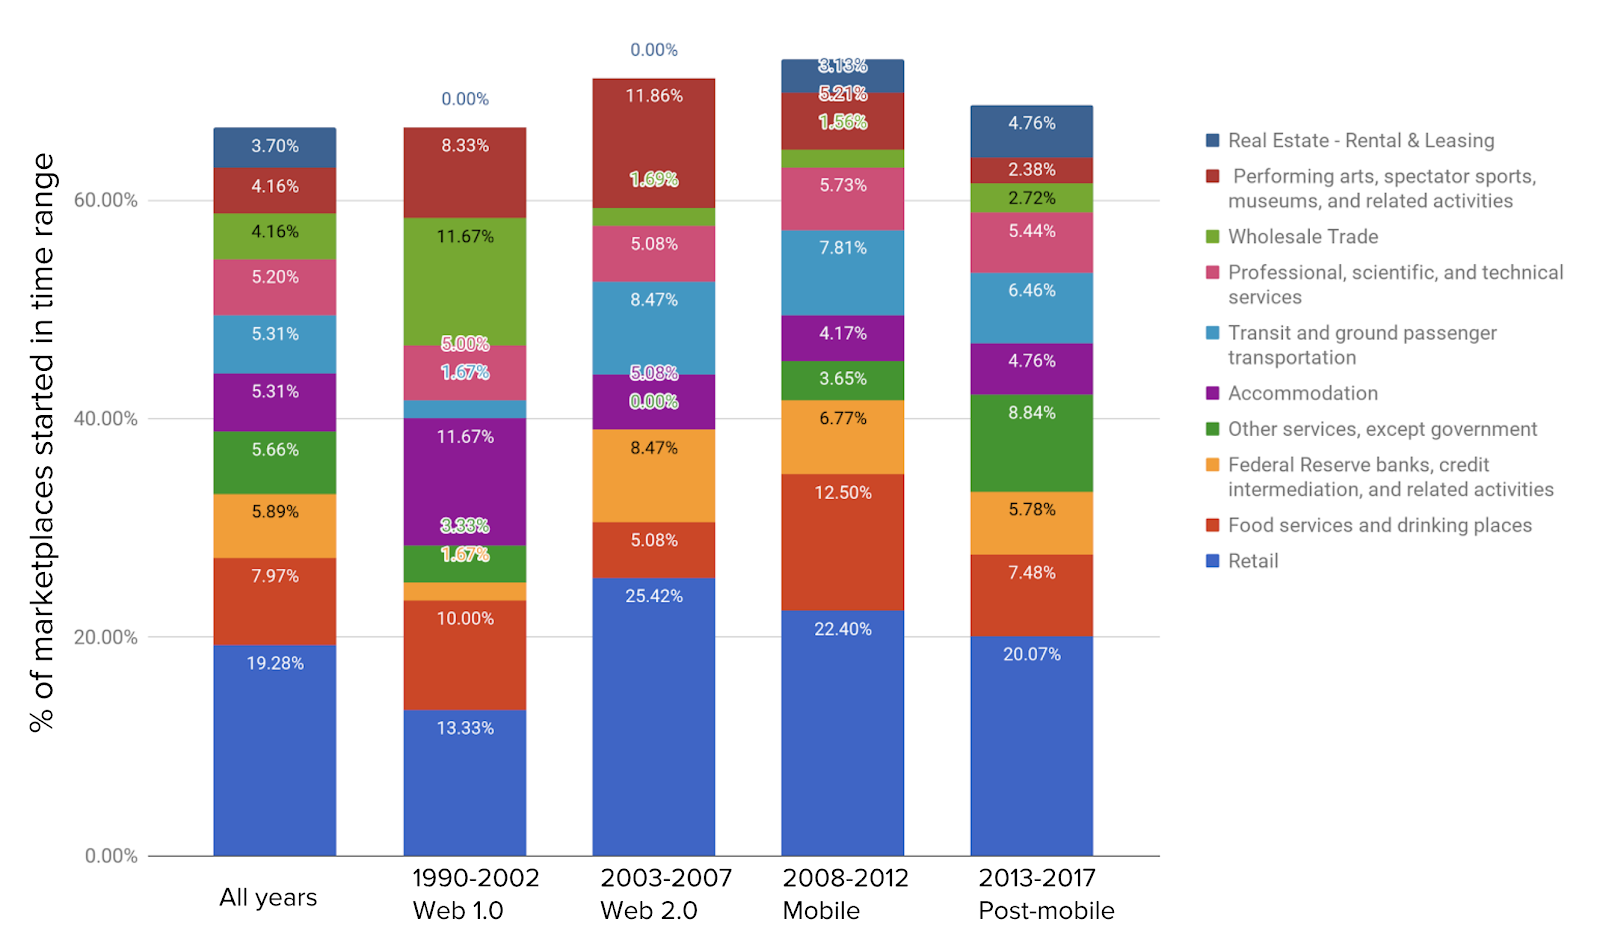
In the mobile period (2008-2012) the most popular categories other than retail were food and ground transportation, two categories of marketplaces that are highly local and require the aggregation of buyers within each city. Uber, Didi and Meituan, the most valuable companies started in this period dominate these categories.

B2B marketplaces are an untapped opportunity

One category of marketplace that stands out in this chart is wholesale trade, which tied for the 3rd most popular category in the Web 1.0 period and included such companies as PaperExchange, Supply Chain Connect, and VerticalNetWith the exception of Alibaba (founded in 1999 as a B2B marketplace) none of the wholesale trade marketplaces started in this period have become large, enduring businesses (Elance, founded in 1999 and now UpWork, is classified as “Professional services”).

In 1999, these companies may have had large addressable markets, but not enough of the decision makers at those business were on the internet and ready to make a purchase. eBay only had 1 million buyers in 1999 and each of these B2B marketplaces would have a much smaller online addressable market.

In the last 16 years, this has changed. Since 2002, the number of global internet users has increased by almost 10 times, from about 400 million to almost 4 billion (half the world’s population). US internet adoption is 89% and 77% of adults have a smartphone.

These trends have driven a massive increase in B2B eCommerce spend. In 2018, Forrester predicts almost $1 trillion will be spent by US businesses on supplier websites (double the size of the consumer eCommerce market).

Much of this spend is by larger companies, but one of the most interesting opportunities for marketplaces will be in more fragmented SMB markets. Since 2002 there are 50% more small businesses in the US and more individuals are now running their own part-time businesses.

There are several B2B markets with more than 1 million buyers just in the US. There are 2 million farms, 2 million active real estate licensees, 1 million restaurants, 1 million doctors, 650,000 construction companies, and 3 million Uber drivers.

Despite these developments, less than 3% of marketplaces founded from 2013-2017 were connecting businesses with other businesses.

The demand from businesses is clearly there: Amazon launched it’s B2B-focused marketplace in 2015 to tackle this market and by January 2018 had already passed $1 billion in revenue with 400,000 business buyers and 45,000 sellers. Auto1Group connects the 1.5m car dealers worldwide and generated over $1.5 billion in GMV in 2016.  Witmart and Upwork connect hundreds of thousands of contractors to hundreds of thousands of businesses that need contract, trademark, design, development, or hundreds of other tasks.

As entrepreneurs, we’re excited by the opportunity to build great products for under-served businesses in huge markets. Over the next 5 years we predict other entrepreneurs will start B2B marketplaces as well, perhaps reimagining some of the ideas that didn’t work 20 years ago.

“There are no bad ideas. There are only early ideas” – Marc Andreessen

Footnotes

  1. The data is plotted on a log scale with a power-series regression line.
  2. We only featured marketplaces where we had data on the number of buyers, suppliers, and revenue. Notable marketplaces missing from this analysis are Craiglist ($700m+ in revenue) and eBay (Almost $10bn in 2017 revenue) which both have millions of monthly sellers and would therefore increase the correlation between the number of suppliers and revenue.
  3. If you know of any that we are missing, please get in touch (marketplaces [@] elichait.com)
  4. Of the 9 marketplaces with $1bn+ of revenue, 6 have more than 1 million suppliers and 3 have less than 1 million suppliers.

Why sharing economy marketplaces have raised over $50bn

Published April 21, 2018

Comparing Revenue / Funding for Sharing Economy vs. Traditional Marketplaces1

This is the second in a series of essays on my learnings and findings from a six month marketplace research project. There has been a lot written about online marketplaces and our goal was to test these theories by exploring patterns from a broader set of companies. We started by making a list of every marketplace founded, creating a list of 4,500 companies from Crunchbase, Pitchbook, and other sources. We collected public data to classify and compare these companies and identify patterns in marketplaces that became successful (read more about the approach).

Sharing economy marketplaces have become the preferred form of marketplaces for entrepreneurs, but they have worse unit economics than traditional marketplaces and require almost 3 times as much funding to achieve the same revenue.

Sharing economy marketplaces have individuals on the supply side of the marketplace, while traditional marketplaces have companies on the supply side. For example, Airbnb has mostly individual hosts while Hotels.com has companies (hotels) as suppliers.

Sharing economy marketplaces have become common despite lower capital efficiency and less attractive unit economics

Since 2007, individual-driven marketplaces like Uber have almost doubled in popularity. Of the 459 marketplaces we analyzed, 56% had individuals as suppliers (e.g. Airbnb), 33% of them had companies as suppliers (e.g. Hotels.com), and 12% had both companies and individuals (e.g. Amazon).

By focusing on individuals, these sharing economy marketplaces typically recruit far more suppliers than traditional marketplaces. By the end of least year, Airbnb had attracted 4 million hosts to Booking.com’s 1.5 million even though Booking.com was founded 12 years earlier and has revenues more than double that of Airbnb.

Sharing economy marketplaces tend to be far less capital efficient than traditional marketplaces, raising 50% more financing to achieve almost half the revenue:

Sharing Economy Marketplaces Traditional Marketplaces
Avg Revenue / Funding 5.71 14.37
Average Funding $207,424,863 $253,255,675
Average Revenue $135,782,620 $458,199,496

Lower capital efficiency is driven primarily by lower average revenue per supplier and higher churn compared to traditional marketplaces.

For an example of this, see Booking.com, which has rapidly scaled its number of bookable properties from 500k in 2014 to over 1.7 million in 2018. This growth has been largely from the “alternative accommodation market” that is more similar to Airbnb’s core supply base. Then-CFO of Priceline Dan Finnegan points out the financial differences with these individual-driven suppliers:

The new alternative accommodation business is somewhat less profitable from a partner services perspective. So there are less rooms for property, a lot of properties still to go and gather, and then, typically, requiring a little bit more help in working with our service because they’re less sophisticated than the hotel properties that we had initially worked with. – Q3 2017 PCLN Earnings Call

In “alternative accommodations” there are fewer rentable rooms for each property but there are still costs to acquire and onboard each property. For every rentable room, the acquisition cost is higher and the service cost is higher.

Individual supplier platforms also experience high rates of a unique type of involuntary churn from suppliers that traditional marketplaces don’t experience. Uber drivers get sick of driving and Airbnb hosts get tired of sharing a bathroom with strangers. 52% of suppliers on labor platforms like Uber quit driving within a year and 56% of suppliers on capital platforms like AirBnB stop hosting guests on any platform within the first 12 months. These attrition rates do not include suppliers leaving for competitors (e.g. leaving Uber to go to Lyft), they are specifically the number of suppliers that decide to leave the industry completely.

Company supplier platforms experience much lower rates of involuntary churn from their suppliers. Restaurants are commonly cited as one of the riskiest businesses to start, but the failure rate of restaurants (17% of restaurants fail in the first year) is far lower than the quitting rate of sharing economy marketplaces.

These rates shouldn’t be surprising when you consider that 55% of Uber drivers use Uber to earn supplemental income, working less than 15 hours per week.  Sharing economy marketplaces like Airbnb and Uber also benefit from the part-time nature of their suppliers, since the supplier pool grows when demand grows:

The need for rides (and therefore drivers) at music festivals or seasonal events or in a vacation town like Tahoe are bursty. That said, these same holiday weekends are when people searching for supplemental income are free from the primary occupation and can make the voluntary decision to earn more money. – Bill Gurley

Airbnb and Uber are incredible businesses, and the conclusion of this post is not that company-driven marketplaces like Groupon and OpenTable are better than sharing economy marketplaces, but that they need to manage suppliers much differently.

Marketplace with companies as suppliers, particularly those with a Single-Player mode, can spend more to acquire suppliers and invest more in making them successful. By comparison, sharing economy marketplaces need to focus on developing product mechanics and incentives that constantly attract new suppliers to the platform.  

eBay has transitioned from being a sharing economy marketplace to a hybrid that includes professional sellers, retail chains, and individual consumers. This is a common pattern and Josh Breinlinger makes the point that the number of full timers on a marketplaces is a key driver of marketplace health. eBay’s Powerseller program, Etsy’s 10k club, and Airbnb’s Plus host program encourage individual suppliers to become professionals that act more like companies in that they rely on the platform more and churn less. With professional suppliers, these marketplaces can invest more in tools and services to make those suppliers be successful. 

Do you have a theory for why sharing economy marketplaces have raised so much more money than traditional marketplaces? Leave a comment here or send me an email (marketplaces at elichait.com)

Thanks to Elaine Hsu, Corey Reese, Miles Skorpen, Wendy Lin, and Nima Wedlake for reading drafts of this post and providing feedback.

Footnotes

  1. Only includes marketplaces where we had revenue and funding data. Excludes Amazon in charts for scale reasons only.

How the 100 largest marketplaces solved the chicken and egg problem

animal-easter-chick-chicken.jpg

Published April 9, 2018

This is the first in a series of essays on the findings from a six month marketplace research project. My co-founders and I sold our last company to OpenTable and spent three years working on products to grow the supply side of OpenTable’s marketplace. There has been a lot written about online marketplaces and our goal was to test these theories by exploring data from a broader set of companies. We started by making a list of every marketplace founded, identifying 4,500 companies in total, then collected public data to classify and compare these companies (read more about the approach).

Company success can be measured in many ways, but in the context of this project, we focused on two key metrics: revenue and capital efficiency (measured as the ratio of revenue to capital raised).1

This post focuses on how the top 100 most successful marketplaces created value for their first users and which of the top three most popular “seeding” strategies has been the most effective. We discovered that one specific marketplace seeding strategy helped companies achieve higher revenue with less capital than other marketplaces.

The chicken and egg problem

A marketplace connects many suppliers to many buyers, typically enabling them to transact with one another and taking a fee for enabling the connection. But since marketplaces create value by aggregating supply and demand this creates the “chicken and egg” problem. What is the value to supply and demand when the marketplace is just getting started and doesn’t yet have many buyers or suppliers? The marketplace’s seeding strategy is how it solves the chicken and egg problem.

OpenTable’s seeding strategy is what Sangeet Paul Choudary calls Standalone Mode and Chris Dixon calls “Single Player Mode.” OpenTable sold software to restaurants that created value for them without requiring any diners on the “buyer” side of the marketplace. They built a unique table management and CRM product (the “Electronic Reservation Book”) and charged a subscription fee for the service. The initial benefit to restaurant customers was the software. Once OpenTable acquired hundreds of restaurants in a city, they started to have a compelling diner value proposition.

From studying the top 100 largest marketplaces (see here for methodology and list of marketplaces) we found that OpenTable’s strategy was actually the most common.  This is also the most capital efficient strategy. Marketplaces that use this approach to seed the marketplace were 10x as capital efficient as marketplaces that used the second most popular strategy.

Top strategy: Overcoming the chicken & egg problem with Single Player Mode

34% of the top 100 marketplaces have some type of Single Player Mode as an initial value proposition. OpenTable employed this strategy to acquire restaurants (supply) before it had diners (demand).

Amazon is an example of a marketplace that used a Single Player Mode to acquire buyers before suppliers. Amazon was a successful retailer before a marketplace. It bought books from other bookstores and publishers and resold them to buyers. This allowed them to create value for buyers without having any sellers participate in the marketplace directly. Once Amazon aggregated a lot of buyers, it allowed other sellers to participate in the marketplace directly by listing their products and setting prices themselves.

2nd strategy: Offering to Fill Empty Seats for suppliers

33% of the top 100 marketplaces seeded supply with the promise of filling empty seats (either literally or metaphorically — selling underutilized inventory) and providing incremental income to existing businesses.

For example, Groupon approached merchants and asked if they would be willing to sell a gift card at a discount as a way to attract new customers and fill slow periods. The service was free and Groupon only took a cut of the sales, which limited the risk to the supplier. Early Groupon employee Shawn Bercuson says:

Many of the merchants expected that we were trying to get them to pay for something upfront, so when we said we only took a percentage of what we were able to sell and they’d never have to pay us out of pocket, they were pleasantly surprised. – Quora

Groupon launched a single deal every day and marketed it aggressively on Google and Facebook. They were able to acquire supply without having any traction with demand, but they only needed a small amount of supply to get started. They attracted that supply with the promise of risk-free incremental income.

Uber had a similar strategy. They started with existing black car drivers and gave them an iPhone running the Uber app so they could accept rides during their down time. Before Uber these limo companies worked primarily on pre-set appointments and their drivers spent much of the day waiting for the next appointment. With Uber, now when they had downtime they could make themselves available in Uber’s app and get some extra business.

Both Uber and Groupon focused on existing businesses that already provided a similar service, convincing them to make their service available to Uber or Groupon’s customers. They did this without having buyers, simply by promising that would fill the empty seats once they attracted users to the platform.

3rd strategy: Create a marketplace where Buyers are Sellers

Peer to peer shopping services OLX and Letgo both use TV advertising to attract users

The third most common strategy is to focus on buyers that would also be sellers on the marketplace, therefore acquiring demand and supply simultaneously. Of the 14 marketplaces that employed this “Buyers are Sellers” strategy, 10 of them are peer to peer shopping apps like Craigslist or eBay. For this strategy to work, there needs to be high overlap between buyers and sellers.

Marketplaces with this approach to creating value for initial users have had very different early user acquisition strategies. OLX and Letgo used TV advertising to attract initial users:

We began with aggressive marketing on Oct. 17, 2015… and back then very few people were aware of Letgo,” he said. “Today, we have surpassed the 45 million downloads milestone a couple weeks ago and a third of all listings are sold. — Letgo founder Alec Oxenford to Forbes

Clothing marketplace Poshmark focused on a small group of active fashion-focused users for 6 months and got them to use the service frequently as both buyers and sellers:

The first phase was what I call the incubation phase… At the end of six months, we only had five hundred users. But three hundred of those users were actually active. They had a closet, they were selling, many of them had bought something and our early-stage thing was really to get a whole architecture of participation going. – Interview with Menlo Ventures

With all of these examples the marketplace was able to recruit buyers and suppliers from the same population and often use one strategy to acquire both supply and demand. 

Which strategy works best?2

Marketplaces seeded with a Single Player Mode have 10x the capital efficiency3 of marketplaces promising to Fill Empty Seats for suppliers:

Seeding Strategy # Companies4 Mean Revenue Mean Funding Mean Revenue / Funding
1. Single Player Mode 19 7,734,114,488 771,136,317 10.03
2. Fill Empty Seats 14 2,567,125,111 2,547,728,090 1.01
3. Buyers are Sellers 9 1,530,477,778 882,583,567 1.73

We believe there are three drivers of Single Player Mode’s capital efficiency:

Less competition – Marketplaces whose initial value proposition is to Fill Empty Seats compete aggressively with other marketplaces for supply. This strategy is designed to make it easy and low risk for suppliers to try out the service, but that also makes it easy and low risk to try out a competitor. Car sharing services, delivery services, and daily deal sites all engage in an expensive battle for supply against competing marketplaces. In many cases the Single Player Mode locks out competitors from working with the same suppliers, giving the first-mover exclusive access to suppliers.

Lower churn – These services are often higher friction to adopt, but they also create extra friction to leave a marketplace (lock in) if the tool is critical to the operation of a business.

Cash flow funds growth – Other types of marketplaces need to spend more aggressively to acquire demand and supply because they need liquidity on both sides of the marketplaces to generate revenue. By comparison OpenTable and MindBody were able to generate subscription revenue from software tools before the marketplace had any liquidity (OpenTable still made a majority of revenue from subscription fees when it went public 10 years after founding). Amazon was able to start as just a book retailer, selling books at a profit and using its cash flow to fund growth. By comparison, Uber and Lyft needed thousands of drivers and hundreds of thousands of consumers to create a compelling value proposition before they could generate significant gross margin.

None of these strategies is objectively better and the best seeding strategy is different for every marketplace opportunity. Car sharing marketplaces have become incredibly successful, impactful business with very different seeding strategies (Lyft used “Buyers are suppliers”, Uber used “Fill Empty Seats”) but none of them used a Single Player Mode.

The reason we separate the seeding strategy from scaling strategy is because once a marketplace achieves sufficient demand and supply, a flywheel helps them rapidly acquire more buyers and sellers. How each of these marketplaces scaled is very different than how they attracted their first buyers or sellers. Despite this shift in value proposition as a marketplace grows, the early seeding strategy can have a significant effect on the marketplaces’ competitive position as they scale and influences the capital requirements of the business.

Investors and founding teams should consider the impact of their company’s initial seeding strategy on future competition. The challenges scaling and capitalizing a company like Lyft or DoorDash in a hyper-competitive market are greater than for a marketplace like OpenTable, whose Single Player Mode locked in suppliers. Founding teams leveraging the “Fill Empty Seats” or “Buyers are Seller” strategies need to be prepared to both out-execute and out-raise their competitors to win.

Thank you to Elaine Hsu, Adam Wagner, Nima Wedlake, Miles Skorpen for reading drafts of this post and providing feedback.

Footnotes

  1. We would have liked to use measures of profitability as well, but these are difficult to find for private companies
  2. One of the major disadvantages with our approach to evaluating marketplace scaling strategies is that it ignores the marketplaces that have failed. It’s harder to get data on these, especially if they were started & failed years ago. I would guess that the failure rate for marketplaces that employ the last strategy (Buyers are Suppliers) is the highest, but I am not able to find much data to support that conclusion.
  3. The biggest marketplaces companies (Amazon, Alibaba, Didi, Uber) skew each of these metrics, but we get similar but less extreme results looking at Median Revenue and Funding:
  4. Seeding Strategy # Companies Median Revenue Median Funding Median Revenue / Funding
    Single Player Mode 19 350,000,000 114,469,760 2.97
    Fill Empty seats 14 431,089,738 893,911,221 0.77
    Buyers are Sellers 9 210,000,000 146,920,000 0.68
  5. This only includes companies where we had data on both revenue and funding.